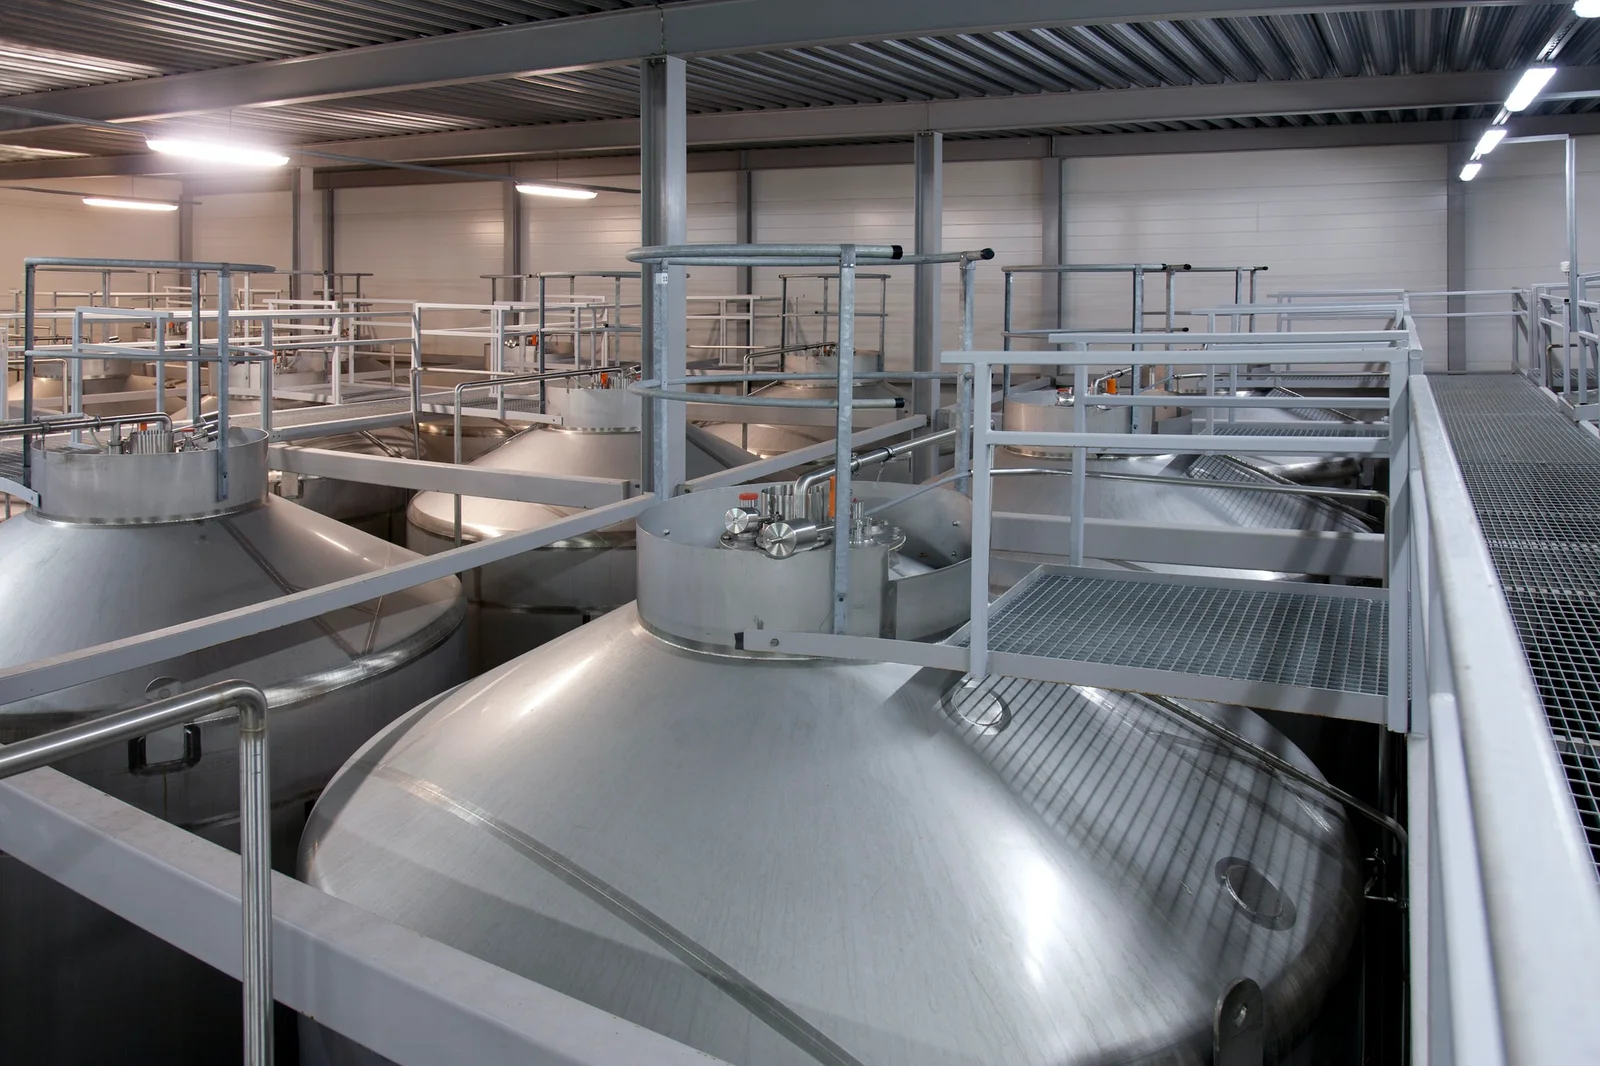
Craft beer equipment lowers operating costs by reducing the resources consumed for every barrel of saleable beer. U.S. EPA material notes that breweries may use roughly 4–12 gallons of water per gallon of beer, while a Brewers Association study using 2014 data from 71 breweries found average water use ranging from 4.58 to 16.72 barrels of water per barrel packaged, depending on production scale. Efficient heat exchangers, insulated tanks, VFD pumps, automated CIP, glycol controls, and higher brewhouse yield reduce utility use, labor hours, chemical consumption, and product loss. Equipment cost matters less when recurring savings continue through thousands of annual operating hours.
The first place to measure equipment economics is water because one gallon entering a brewery may be paid for several times: purchase, pumping, heating, chemical treatment, and wastewater discharge. EPA material published in 2022 cited an industry range of about 4–12 gallons of water for each gallon of beer, and Brewers Association guidance notes that breweries without an effective conservation program can exceed 10:1. A 10,000-barrel brewery moving from 8:1 to 5:1 would avoid roughly 30,000 barrels, or about 930,000 gallons, of annual water use before production growth is considered.
Equipment design determines whether that reduction is realistic. Rotary spray heads, correctly sized CIP pumps, conductivity sensors, flowmeters, automatic rinse sequencing, and separate recovery tanks allow cleaning cycles to use measured volumes instead of an operator leaving a hose or rinse step running longer than necessary. In the Brewers Association's 2015 benchmarking report, 71 breweries supplied 2014 water data; average water use fell from 16.72 barrels per packaged barrel among breweries below 1,000 barrels per year to 4.58 among breweries above 100,000 barrels. Scale explains part of the difference, while greater automation and tighter cleaning control were also identified as contributing factors.
Water savings should be calculated as more than the local water tariff. The Brewers Association's water guidance includes wastewater treatment, labor, energy, treatment chemicals, and sludge handling when evaluating conservation projects; one cost example treated 40% of wastewater-treatment expenditure as flexible cost that could change with conserved water.
Once water is controlled, heating becomes easier to manage because breweries spend substantial energy raising water and wort temperatures. A plate heat exchanger can cool wort while transferring its heat into brewing water, allowing the receiving water to enter the hot-liquor system already heated instead of starting near incoming mains temperature. A brewery cooling several brews per day receives that recovered heat after every batch, so the annual result depends more on batch count and recovered-water use than on a single impressive efficiency figure.
Steam systems offer a similar opportunity. When steam gives up heat in a kettle, mash vessel, or cleaning system, it forms hot condensate; the Brewers Association energy manual recommends condensate recovery because returning hot condensate reduces both make-up water and the energy needed to heat replacement water. A steam-heated brewery running 250 production days in a year can therefore gain from well-insulated steam lines, maintained traps, condensate return, and correctly sized jackets on every operating day rather than only during peak production.
| Equipment area | Cost that can be reduced | Measurement to request from a supplier |
|---|---|---|
| Wort heat exchanger | Heating and refrigeration | Wort inlet/outlet temperature, water ratio, recovery temperature |
| CIP system | Water, chemicals, labor | Liters per cycle, pump kW, cycle time, chemical concentration |
| Glycol system | Electricity | Compressor kW, design load, part-load performance |
| Transfer pumps | Electricity and beer loss | Motor kW, flow range, VFD control, residual volume |
| Fermenters | Cooling and cleaning | Insulation thickness, jacket area, CIP coverage |
| Packaging line | Beer and packaging loss | Fill accuracy, rated speed, reject rate, changeover time |
Motor selection follows the same cost pattern. The U.S. Department of Energy reported in 2012 that motor-driven equipment accounted for well over half of industrial electricity use in the United States, and DOE guidance identifies variable-speed or variable-frequency drives as a common efficiency measure where motor demand changes with process load. A brewery pump that needs maximum flow during one transfer but lower flow during recirculation does not need to operate at full speed for every minute of a 2,000-hour annual duty cycle.
That principle matters when evaluating a brewhouse because pump nameplate power alone says little about yearly cost. Buyers should ask for expected operating hours at 25%, 50%, 75%, and 100% flow, along with control method and motor efficiency. Throttling a fixed-speed pump wastes pressure across a valve, while VFD control lets the motor operate closer to actual process demand; the financial comparison should use local electricity rates multiplied by predicted annual kWh rather than comparing motor purchase prices.
Energy saved in the brewhouse can still be lost in the cellar if fermentation tanks, glycol piping, or cold rooms have weak insulation. Fermentation generates heat, and beer may then be cooled further for conditioning and packaging, so every watt entering through warm pipework or tank surfaces has to be removed by the refrigeration system. For a brewery operating 365 days a year, refrigeration equipment can accumulate far more annual operating hours than a brewhouse used only on brewing days.
A glycol system should therefore be sized from calculated tank loads, crash-cooling schedules, ambient conditions, cold-room demand, piping heat gain, and simultaneous production requirements. Oversizing is not automatically cheaper: compressors frequently operating far below design output may perform differently from their rated full-load condition, while undersizing can extend cooling time and restrict tank availability. Supplier quotations are more useful when they include compressor input kW and part-load data at several operating points rather than only nominal cooling capacity.
Tank design then links cooling cost to labor cost. Smooth internal finishes, sanitary fittings, suitable outlet geometry, full spray coverage, and accessible valves shorten cleaning work and reduce places where residue can remain. If an automated CIP sequence saves only 15 minutes on each of four vessel cleans per day, the reduction is 1 labor hour per production day; across 250 days, that is 250 hours before counting shorter pump, hot-water, and chemical operating time.
Automation also reduces repeated manual checks. Temperature probes, level sensors, timed steps, automatic valves, pump interlocks, recipe control, and alarms can replace tasks such as watching vessel levels or repeatedly adjusting heating valves. The equipment still needs trained operators, but a brewer supervising a controlled process can spend less time on routine valve movement and more time on yeast management, sensory checks, cellar scheduling, maintenance, and quality records.
The financial effect becomes larger when automation prevents product loss. A 20-barrel batch contains about 620 U.S. gallons; losing 2% through poor transfer, foaming, avoidable tank residue, or packaging problems removes roughly 12.4 gallons before considering the packaging material already prepared for that beer. At 2,000 barrels of annual output, improving saleable recovery by only 1 percentage point preserves about 20 barrels of product.
Brewhouse yield affects raw-material cost in the same way. In a 2026 Brewers Association resource on mash-tun performance, the association noted that a 10% increase in extract efficiency could represent roughly one less bag of malt per batch in an illustrative brewery case. Lauter-tun geometry, false-bottom area, grist quality, mash mixing, sparge distribution, wort collection, and flow control all influence how much extract reaches the kettle instead of leaving with spent grain.
Packaging needs equal attention because losses at the filler occur after malt, hops, water, energy, refrigeration, labor, and tank time have already been spent. A filler that produces excessive foam can waste beer on every package, while inaccurate filling can increase giveaway or rejects; poor line balance can leave a 40-can-per-minute filler waiting for a slower labeler or pack-off station. Rated speed should therefore be compared with sustained speed during an 8-hour shift, including changeovers, sanitation, stops, and rejected packages.
Maintenance changes the calculation again. Two pumps with similar flow and motor ratings can have different lifetime costs if one uses commonly available seals, bearings, and motors while the other requires proprietary parts with long lead times. A $500 component is a small expense compared with a production interruption that idles a brewhouse, delays fermentation scheduling, and ties up several employees for half a shift, so spare-parts availability and service access belong in the purchase specification.
A practical equipment quotation should include at least the following operating information:
-
installed motor power and estimated annual operating hours;
-
hot-water and steam requirements per brew;
-
cooling capacity and compressor input at several load levels;
-
CIP volume, temperature, circulation time, and chemical concentration;
-
expected brewhouse yield and normal transfer losses;
-
filling accuracy, sustained packaging speed, and normal reject rate;
-
recommended preventive-maintenance intervals and spare-part lists;
-
utility connections and capacity available for later tank additions.
With those numbers, Turn-Key brewery solutions can be compared on total installed and operating cost rather than tank count alone. A brewery planning 5,000 barrels in year one and 10,000 barrels by year three may save capital by installing utilities, control capacity, glycol headers, floor drainage, and piping connection points that allow fermenters to be added later without replacing the original brewhouse.
Expansion planning matters because the Brewers Association's 2014 dataset showed a large scale effect in water use: breweries producing 10,000–100,000 barrels averaged 5.98 barrels of water per packaged barrel, while facilities above 100,000 barrels averaged 4.58. Those figures should not be treated as guaranteed targets for a new plant, but they provide a useful reference when estimating whether a proposed system uses utilities at a reasonable rate for its production class.
Purchase price can then be tested against a simple operating model. If a higher-specification system costs $40,000 more but saves $8,000 in labor, $5,000 in water and wastewater, $6,000 in energy, $3,000 in cleaning chemicals, and $4,000 in recovered beer each year, annual savings reach $26,000 and simple payback is about 1.54 years. The Brewers Association energy manual recommends evaluating project cost together with installation, commissioning, downtime, personnel requirements, expected savings, equipment life, and supplier guarantees rather than looking only at quoted machinery cost.
For management, the useful operating dashboard is small: gallons of water per gallon of packaged beer, kWh per barrel, fuel use per barrel, labor hours per batch, CIP gallons per vessel, brewhouse extract efficiency, packaging loss percentage, and maintenance hours. The Brewers Association was still publishing updated sustainability benchmarking resources in 2026, reflecting continued industry use of water, energy, wastewater, solid-waste, and emissions measurements for brewery performance comparisons.